
Lead generation metrics are the figures a company settles its acquisition process with — from a site visit to a confirmed order — and most of them are ratios, which is why two companies quoting the same metric are not necessarily counting the same thing. This page sets ten metrics measured on the laboratory's own account against benchmarks published in the industry, breaks cost per lead into its three denominators, checks how many enquiries turn into orders and whether paid traffic brings weaker leads, shows where measurement itself is incomplete, separates vanity metrics from results, and ends with how to build a set of metrics of your own.
Which lead generation metrics actually mean something?
The ones with a denominator printed next to them. A metric without a denominator is a number, not a result — and the difference can be six-fold inside one advertising account, in the same period, across the same campaigns.
The drySEO laboratory runs its own B2B account as a measurement testbed. We recalculated a full year of the funnel: site traffic, advertising spend, commercial enquiries recorded in the CRM, and confirmed orders. The reading was taken nine months after the period closed, so that enquiries with a long buying cycle had time to resolve. Then every figure was placed next to a benchmark published in the industry. The ten confrontations below are the result of that work.
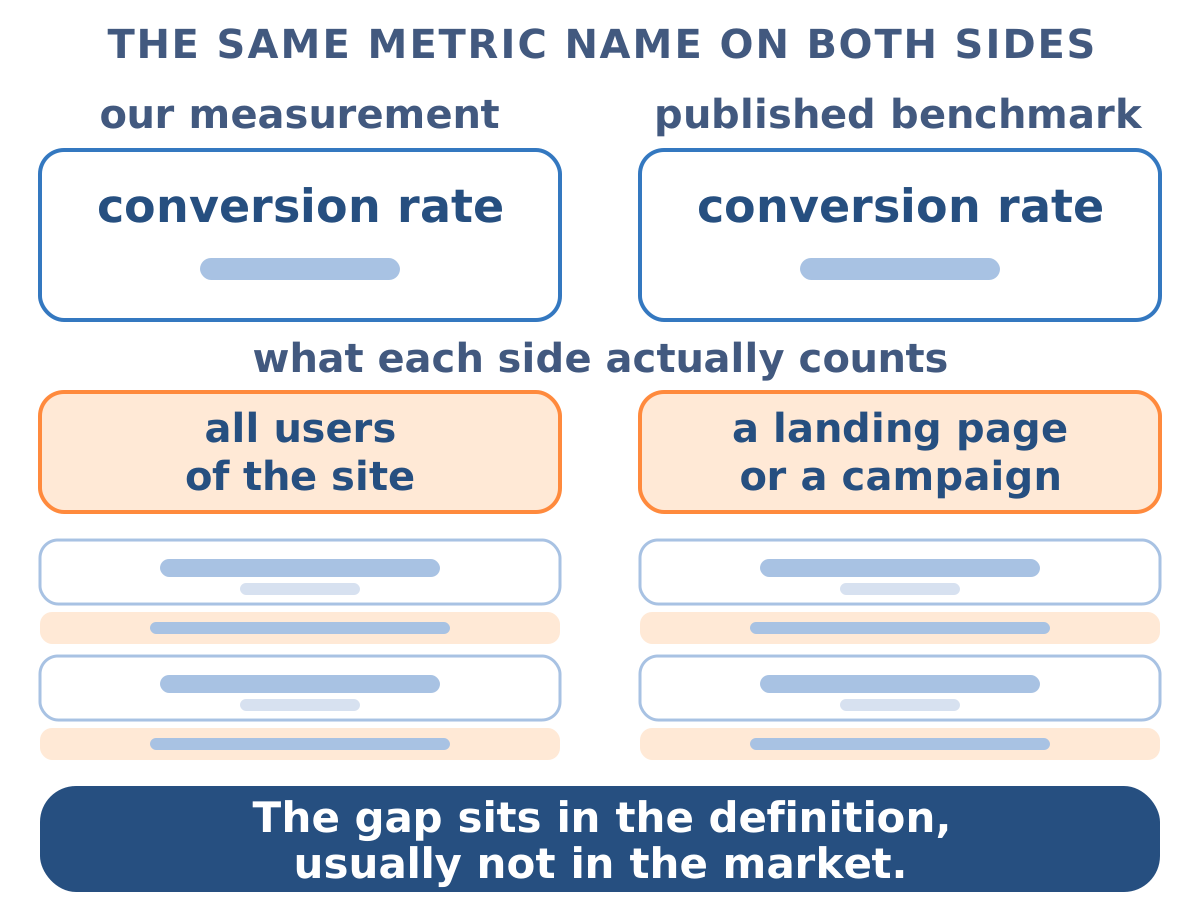
One finding repeats in almost every row: the gap between “our number” and “the benchmark” usually came from the definition, not from the market. More about how the lab works: drySEO Lab.
Lead generation benchmarks versus one year of measurement
Ten confrontations, each with its denominator. Measured values are drySEO lab data; benchmark values are published figures, linked below the table.
| # | Metric | Published benchmark | drySEO lab data | Verdict |
|---|---|---|---|---|
| 1 | visit → commercial enquiry | 1.2–2.5% | 0.8% | 1.5–3× below |
| 2 | enquiry → order, inbound B2B | 8–12%, top tier 15–20% | 13.6% | above the band, below the top tier |
| 3 | median B2B conversion rate, all industries | 2.9% | 0.8% | not comparable — a different definition of conversion |
| 4 | “paid traffic brings lower-quality leads” | industry opinion | 15.25% versus 11.82% | contradicted (p ≈ 0.014) |
| 5 | median cost per click | USD 5.87 | PLN 6.77 | 3.2–3.7× cheaper |
| 6 | median cost per lead | USD 75.19 | PLN 237 or PLN 411 | below or above — depending on the numerator |
| 7 | spread of cost per lead between sources | USD 45–819 = 18× | PLN 73–452 = 6.2× in one account | the spread is definitional, not market-driven |
| 8 | median click conversion rate | 8.20% | no common denominator | cannot be compared honestly |
| 9 | the ready-made funnel chain from industry defaults | 4.5% closing when multiplied out | 13.6% | three times higher, with the first threshold overstated 6–7× |
| 10 | how much an ad panel undercounts conversions | no published benchmark | 1.4–1.9× | a gap in industry reporting |
Denominators behind the measured values — numbers match the “#” column:
- 1 — all site users ÷ commercial enquiries in the CRM.
- 2 — orders ÷ commercial enquiries, noise removed.
- 3 — the published figure counts landing-page or campaign conversion, the measurement counts all site users; two different denominators, hence the verdict.
- 4 — orders ÷ enquiries from the same form, channel recognised by campaign parameter.
- 5 — account cost ÷ clicks.
- 6 — the first value: spend on foreign markets ÷ enquiries carrying a campaign parameter; the second: the full cost of the account on the same denominator.
- 7 — three denominators on one spend on foreign markets; the numerator is the same in all three figures.
- 9 — the ready-made chain multiplies 5% / 30% / 15%; our measurement is orders ÷ commercial enquiries, as in row 2.
- 10 — enquiries with a campaign parameter in the CRM ÷ conversions counted in the panel.
Benchmark sources: First Page Sage, Zeliq, Ruler Analytics (2025, cited after Martal), SalesHive, NUMRIQ, WordStream, WebFX, Sopro, Flyweel.
Two reading notes. Measured values are in Polish złoty, because that is the currency of the account; currency equivalents quoted further down assume 3.7–4.3 PLN to the dollar, which is an assumption, not a measurement. And the benchmarks come from figures published for 2025, so they describe roughly the same period as the measurement.
Why is cost per lead three numbers rather than one?
Because the numerator stays the same while the denominator can be set three different ways — and all three are honest.
In one account, in one period, the cost of acquiring a commercial enquiry from foreign markets came out as PLN 73, PLN 237 or PLN 452 (drySEO lab data):
- PLN 73 — advertising cost divided by all enquiries from the foreign markets served. It answers “what does presence on these markets cost me”, but it credits advertising with enquiries that arrived through organic search and referrals.
- PLN 237 — cost divided by enquiries carrying a campaign parameter and found in the CRM. This is the closest to the truth about advertising itself, because the numerator and the denominator describe the same event.
- PLN 452 — cost divided by conversions counted in the ad panel. The number marketing most often reports upwards, and the most inflated of the three.
On the full cost of the account the same metric gives PLN 411 (drySEO lab data). The 6.2× spread does not describe a market — it describes three definitions of one phenomenon. For comparison, the published spread of cost per lead between traffic sources is 18×, which suggests that a large share of the industry range is not a difference in performance at all, but a difference in denominators.
How many qualified leads turn into orders?
In the laboratory measurement, 13.6% — confirmed orders divided by commercial enquiries after noise was filtered out, within a band of 11.6–15.0% depending on what counts as an enquiry (drySEO lab data).
That sits above the published band for good B2B inbound (8–12%) and below the top tier (15–20%), both from the benchmark compilations linked under the table. It is also three times higher than what the popular “5% / 30% / 15%” chain produces when the three steps are multiplied together — 4.5%, the plain arithmetic product of 30% and 15%.
The ready-made chain is wrong twice, in opposite directions:
- the first threshold is overstated 6–7× — a knowledge-driven site converted visits into enquiries at 0.8% of all users (0.7% after filtering noise; drySEO lab data — all site users ÷ commercial enquiries in the CRM), not the chain's 5%;
- the last threshold is understated 3× — closing is 13.6% (drySEO lab data — orders ÷ commercial enquiries), not the chain's 4.5%.
Two errors pointing opposite ways multiply into a result that looks plausible. That is why funnel stages are checked one at a time, each with its own denominator, instead of chaining defaults.
Does paid traffic bring lower-quality leads?
The measurement points the other way — in the same form, enquiries from advertising closed at 15.25% and enquiries from organic search at 11.82%, which is 1.29× in favour of advertising, at statistical significance p ≈ 0.014 (drySEO lab data).
Three qualifications, without which that figure misleads:
- The reference group excludes direct enquiries — those arriving outside the form, by e-mail or phone. That pool closes at 25.55% (drySEO lab data — orders ÷ enquiries outside the form), largely because it consists of returning customers; folding it into “organic” would reverse the result.
- The channel is recognised by a campaign parameter, not by the last session source.
- This is about the closing rate of an enquiry, not the number of enquiries. Advertising and organic search deliver different volumes at different costs.
The practical conclusion runs against the received opinion: advertising brings a contact closer to the decision, while a knowledge-driven site works earlier and wider. Two roles, not a ranking — and the sales team benefits from knowing which of the two a given enquiry came from.
How does data accuracy affect lead generation results?
It decides whether the other metrics mean anything, because every benchmark quietly assumes the measurement is complete. Three findings from the measurement say it rarely is.
An ad panel sees less than actually happened — by a factor of 1.4 to 1.9 (drySEO lab data). Enquiries carrying a campaign parameter and found in the CRM, against conversions counted in the panel. The direction is one-sided: the panel never sees more. The reasons are mundane — cookie consent, private browsing, a change of device between first contact and enquiry, a phone call instead of a form. The consequence is serious: anyone who optimises campaigns against the panel figure systematically overstates acquisition cost and switches off campaigns that are in fact delivering.
A control from a third, disjoint system agreed closely: paid traffic accounted for 19.99% of key events in analytics, and submissions carrying an advertising parameter accounted for 19.57% of CRM records. Two independent systems differed by 0.4 of a percentage point (drySEO lab data).
46.2% of spend carries no named country. Some campaign types report no geography at all — that is 27.1% of the budget; a further 19.1% falls into an “other locations” row. Per-market analysis leaves those campaigns out, while their enquiries still land in the denominator. Hence the rule: the campaign scope has to be identical on both sides of every ratio — and that agreement is visible in no column of any standard report.
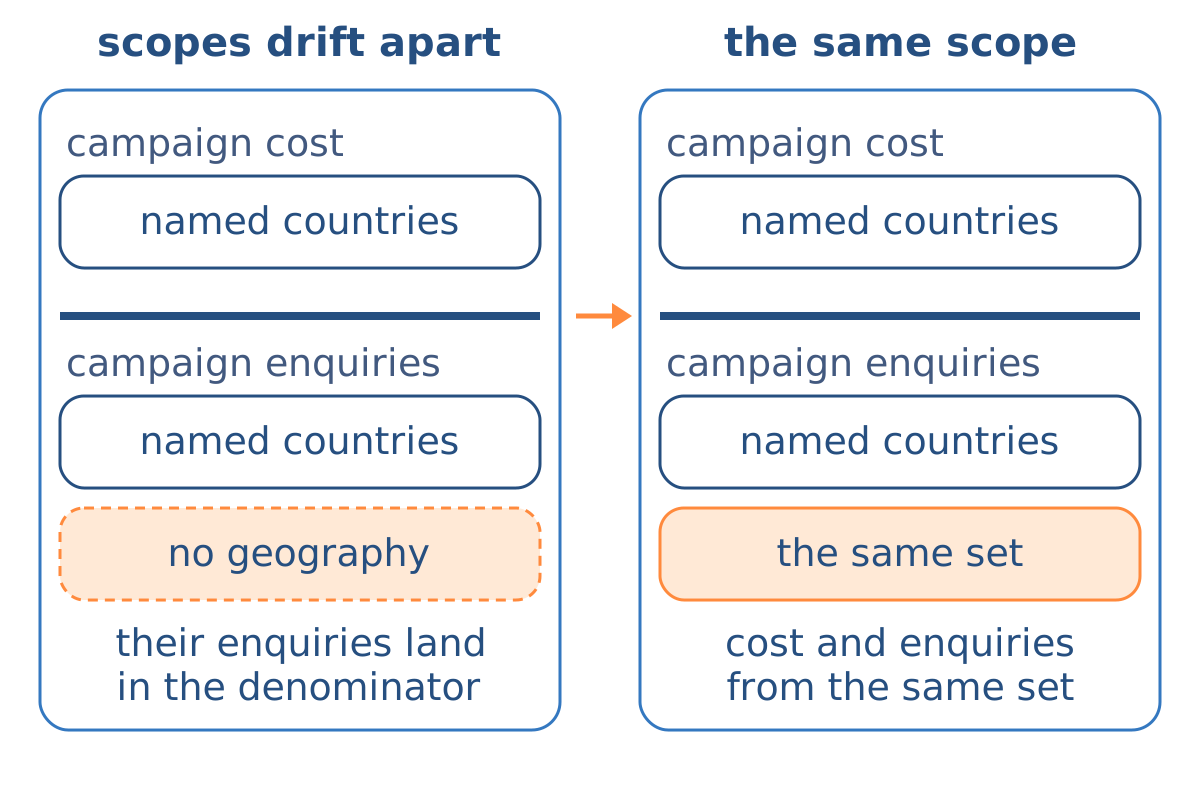
“Country” means three different things at once. The ad panel knows where the system matched the user. The CRM knows where the company is billed. The search console knows where the search was performed. When sales runs through intermediaries, those three definitions diverge systematically rather than randomly: in this measurement 75 enquiries with an advertising parameter came from markets where not a single złoty was spent, and 7% of enquiries have no country in the CRM at all (drySEO lab data — enquiries without a country ÷ all enquiries in the CRM). Tooling that carries the parameter through is covered in the automation guide.
What are vanity metrics, and why do they distort lead generation?
A vanity metric is one that moves without any denominator attached to a business event — impressions, reach, follower counts on LinkedIn, downloads, time on page read on its own. They distort because they always go up when activity goes up, so they can never contradict the person reporting them.
The test is a single question: which decision changes if this number doubles? If the answer is “none”, the number belongs in a diagnostic view, not in a performance report. Two practical consequences:
- An impression count with no click-to-enquiry denominator cannot tell a working campaign from an expensive one. Cost per lead can, once you state which of the three denominators you used.
- A conversion rate quoted with no definition of the conversion event is a vanity metric in disguise. Row 3 of the table above is exactly that case: 0.8% (drySEO lab data — all site users ÷ enquiries in the CRM) and 2.9% (a published median for landing pages and campaigns) are not two results, they are two definitions.
Every metric in the ten confrontations survives that test, because each one has an event and a denominator behind it — and that is the whole difference between a KPI and a number that flatters.
How do you build your own set of lead generation metrics?
Six steps, in this order:
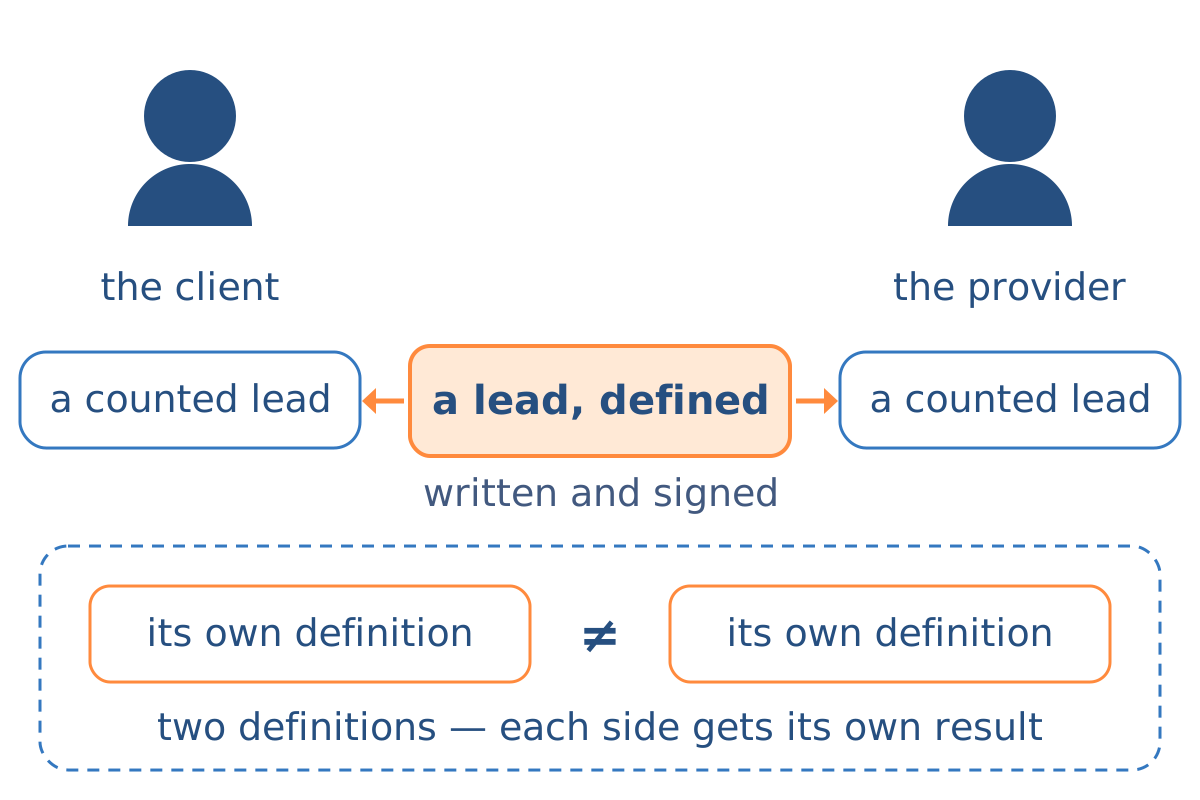
- Define the event you call a lead. A commercial enquiry, not a content download and not a newsletter signup. One written sentence, and the sales team has to sign off on it.
- Set a denominator for every metric and record it next to the value. Without that, the first quarter-to-quarter comparison compares two different things.
- Tag campaigns with a parameter that survives into the CRM. It is the only way to see the difference between what the panel shows and what happened.
- Run two disjoint systems side by side. Analytics and CRM counted separately; agreement within a percentage point is the strongest evidence available at low cost.
- Measure closing with a lag that covers your buying cycle. A reading taken right after the period understates everything with a long cycle.
- Check stages one at a time. No chains built from borrowed defaults.
A set built that way serves one purpose: settling work by result rather than by activity. That is what the cooperation model for SEO and SEM work stands on — billing per lead requires that a lead be counted the same way on both sides of the table.
What does this measurement cover?
One advertising account, one website and one CRM over a full year, with the reading taken nine months after the period closed. It covers organic, paid, direct and referral traffic; commercial enquiries from forms as well as phone contact recorded in the CRM; and confirmed orders.
Outside its scope: order values broken down by source, intermediate funnel stages (qualification and quotation have no separate marker in this CRM), the exact parameter capture rate — hence a band of 1.4–1.9× (drySEO lab data) rather than one figure — and channels that were not run during the period.
Figures from one account are an observation, not a law. What transfers to any B2B company is the counting method and the definitional rulings, because those travel where values do not. How to measure visibility in a channel that has no panel of its own yet: AI SEO: Brand Visibility in AI Search.
Frequently asked questions about lead generation metrics
What should a B2B lead cost?
The answer starts with the question “a lead counted how?”. In one account, the same spend on foreign markets priced against three denominators gives PLN 73, PLN 237 or PLN 452 (drySEO lab data) — roughly USD 17–20, USD 55–64 or USD 105–122 at the conversion assumption above. A useful conversation about cost starts from the definition of the event and from the value of the order the lead produces.
What is a good conversion rate for a B2B website?
It depends on the role of the site. A knowledge-driven site that attracts demand from markets with no advertising spend converts mechanically lower — in this measurement 0.8% of all users, with enquiries arriving from 185 countries and traffic from 243 (drySEO lab data). A purely commercial site converts higher and reaches less far. Judging both against one benchmark makes no sense.
Can ad panel data be trusted?
For steering a campaign, yes; for settling a result, no. The direction of the error is known and one-sided: the panel sees less, here by 1.4–1.9× (drySEO lab data). Adding a parameter that survives into the CRM is enough to see the size of that gap in your own account.
How long should you wait before measuring closing?
Long enough to cover the buying cycle. Measured on the lab's last thousand leads, cumulatively: 7.07% of closings came within 3 days, 41.65% within 45 days and 65.96% within 75 days (drySEO lab data — closings ÷ time since the lead's entry; a share of closings, not of leads). In other words, a third of the closings arrive after day 75, and a reading taken straight after the quarter does not see them yet.
What is the difference between demand generation and lead generation metrics?
Demand generation metrics describe reach and interest before anyone identifies themselves; lead generation metrics start at the moment an identifiable commercial enquiry exists. Mixing them produces row 3 of the table above — two honest numbers that were never measuring the same event.
Will these numbers hold for my company?
The values, not necessarily — they depend on market, cycle and product. The method does: a definition of a lead, the denominator recorded next to the value, a parameter in the CRM, two disjoint systems for control, and a delayed reading.