
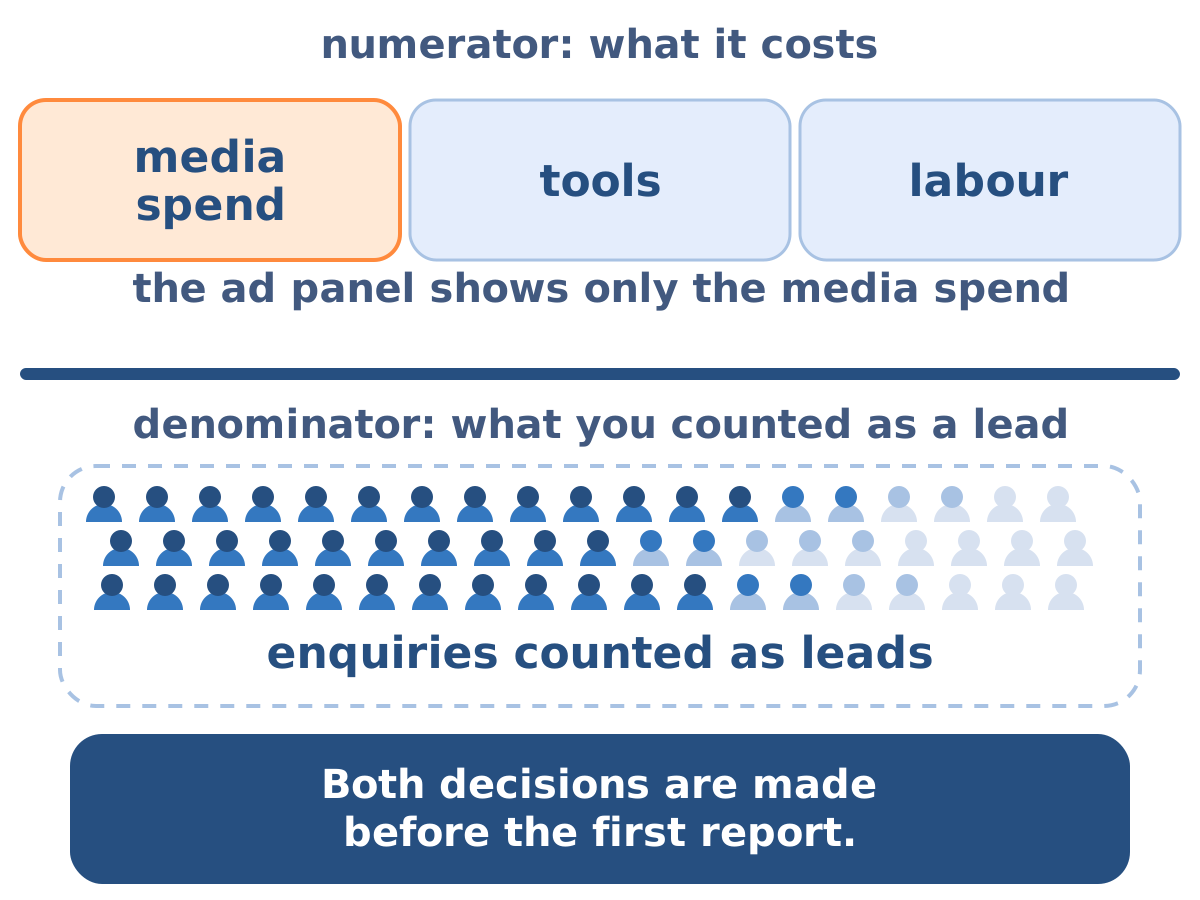
Lead generation cost is the total a business spends to attract and convert potential customers — advertising, content, tools and labour — and cost per lead is that total divided by the number of leads it produced.
The formula is trivial. Everything that makes the number useful or useless sits in the denominator, and that is what this page is about: how to calculate cost per lead, why published benchmarks answer the question badly, which metrics sit around CPL, what actually moves it, and how to bring it down. It covers the money side of B2B lead generation.
What does cost per lead mean?
Cost per lead (CPL) is the total cost of a campaign divided by the number of leads it generated. The campaign cost includes advertising budget, tools, and the salaries or fees of the people running it.
CPL = total campaign cost ÷ number of leads acquired
Two decisions turn that formula into a number. The first is what goes into the numerator: an advertising budget alone understates the real cost, because tools and labour are part of producing a lead. The second is what counts as a lead in the denominator — and it is the second that does the damage, because it is rarely stated and it moves the result by more than any optimisation will.
Why do published cost-per-lead benchmarks answer the question badly?
Published benchmarks answer badly because the denominator alone moves the result by a factor larger than the differences the benchmark is trying to describe.
This is measurable, and the drySEO laboratory measured it on its own B2B account: one spend on the served foreign markets, one account, one full year, divided three ways. The cost of the campaigns attributed to the served markets, divided by all leads from those markets, gives PLN 73; divided by leads carrying a campaign parameter, PLN 237; divided by the conversions counted in the ad panel, PLN 452 (drySEO lab data).
That is a 6.2× spread produced by definitions, on one account, in one period. Any industry benchmark spanning less than 6.2× is therefore describing its authors' counting conventions at least as much as it describes their market. A figure quoted without its denominator is compatible with almost any account, which is what makes it unusable for a decision.
There is a second, compounding effect. The same measurement showed the ad panel counting 1.4–1.9× fewer conversions than the CRM — leads carrying a campaign parameter found in the CRM, divided by the conversions counted in the panel, with a control from a third system agreeing to within 0.4 percentage points (drySEO lab data). The direction is one-sided: the panel sees fewer. A cost per lead read straight from an advertising panel is therefore the highest of the available figures, and it is also the one most often quoted, because it is the one the panel displays.
Calculate your own cost per lead
This calculator does not price drySEO — it works out your own cost per lead, depending on what you put in the denominator. Enter four numbers from your own campaign; the rest is plain arithmetic in this browser, nothing is sent to a server.
How we calculate it
- Cost per CRM lead = campaign spend ÷ CRM leads from this period (all markets in the campaign).
- Cost per lead with a campaign parameter = campaign spend ÷ CRM leads carrying a campaign parameter.
- Cost per panel conversion = campaign spend ÷ conversions counted in the advertising panel.
The result depends only on the four numbers you enter above. Nothing is sent to a server or stored in the browser — this is plain arithmetic, computed locally, right here.
The workable answer to “what is a good cost per lead” is consequently local: fix one definition, write it down, and measure your own movement against it. Where an external comparison is genuinely needed, use only figures that publish their denominator.
How do you calculate cost per lead correctly?
Calculate cost per lead per channel rather than across the whole budget, and decide the denominator before the first report rather than after it.
Four steps make the number comparable over time:
Define a lead
Write down which submission counts, which is excluded as noise, and which system holds the authoritative count. This single artefact prevents most later disputes.
Assemble the full numerator
Media spend plus tools plus the labour of the people running the work. CPL from media spend alone understates the real cost and makes organic channels look artificially expensive by comparison.
Separate spend by channel
Campaign tagging on links and analytics events on forms give each conversion an attributable source. Without that separation, cheap channels subsidise expensive ones in the reporting and budget flows to the wrong place.
Recalculate at the qualified stage
Cost per qualified lead is CPL divided by the qualification rate, and it is the figure that actually compares with the value of a customer.
What goes into the numerator of cost per lead?
The numerator of cost per lead is everything spent to produce the contact — media, tools and the labour of the people running the work — and the figure stops being comparable the moment two parties fill it differently.
Three decisions settle it, and all three belong in writing before the first report rather than in the argument after it. Which spend lines count: media alone, media plus tools, or media plus tools plus the hours of the people producing the content and running the campaigns. Whose hours those are: the marketing side only, or the salespeople who work the contacts afterwards. And what the account scope is: the campaigns attributable to the markets being reported on, or the whole account including the spend that carries no market at all.
That last decision is worth more than most optimisation, and it is measurable. Counted on the full cost of the account, cost per lead on the laboratory's own account comes to PLN 411 — the whole account spend divided by enquiries carrying a campaign parameter (drySEO lab data). Read against the narrower numerator used in the measurement above, where only the campaigns attributed to the served foreign markets are counted, the distance between the two figures is the price of one attribution decision: the market, the campaigns and the leads were the same in both.
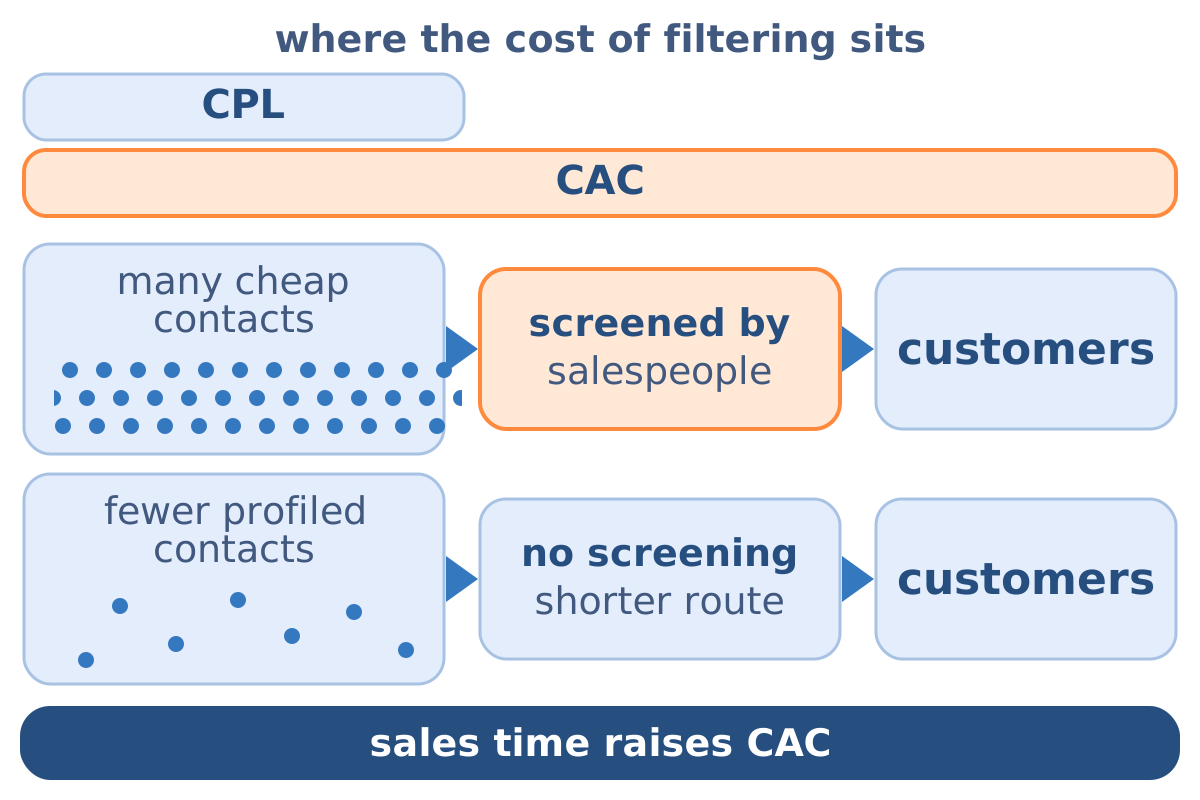
Sales time is the one component that belongs somewhere else. Cost per lead ends at the contact, so the hours a salesperson spends qualifying it sit in customer acquisition cost rather than in CPL, and a numerator that includes them produces a figure no published cost per lead can be read against. There is no drySEO lab figure for that component: the laboratory's exports separate media and tools, not hours, so a number put there would be an estimate wearing the clothes of a measurement.
Why is cost per lead hard to attribute by market?
Cost per lead is hard to attribute by market because a large share of advertising spend carries no country attribution at all.
On the laboratory's own account, 46.2% of the budget had no named country attached, and 27.1 percentage points of that came from campaign types that carry no geography in the first place (drySEO lab data, cost with no named country ÷ account cost). Nearly half the spend therefore cannot be assigned to a market without a modelling assumption, which means any per-market cost per lead is a figure with an estimate inside it.
The consequence is practical rather than theoretical. A per-market CPL comparison built without acknowledging this will attribute to market performance what is actually an artefact of how campaign types report geography. Stating the unattributed share alongside the comparison is what keeps the conclusion honest.
What factors influence cost per lead?
Four factors move cost per lead, and the measurement shows that one of them behaves in the opposite direction from the common assumption.
Audience precision. The narrower and harder to reach the group, the higher the cost of reaching it. This is the factor most under a marketer's control and the one that repays attention first.
Market. The received wisdom is that Western markets cost two to four times more than a home market, and measurement partly confirms it while partly reversing it. Cost per click ranged PLN 2.53 to PLN 10.55 across markets, a 4.2× spread, with the whole account at PLN 6.77 — costs divided by clicks after summing rows, which is the correct order of operations, since averaging the per-row averages introduces an error of up to 11% (drySEO lab data). Cost per lead at market level ran about 3.1× apart in the same direction. The relationship then reverses for a lead actually sourced from advertising: on that basis the most expensive market by click was 0.46× the home market — because the share of a market's leads that advertising delivers varies enormously, from a small fraction on the home market to close to half on the most distant one. Same account, same period, opposite conclusions depending on the denominator.
Lead quality. A cheaper lead that never qualifies raises the cost of a customer while lowering the cost of a lead. This is the reason CPL is read together with the qualification rate rather than alone.
Channel mechanics. Channels that capture existing intent behave differently from channels that interrupt, and organic channels trade a low marginal cost against a long build. The comparison across channels is only meaningful once each one is measured on the same definition of a lead.
How does CPL relate to CAC, CPC and CPA?
CPL sits inside a family of cost metrics that measure different points on the same route, and using the wrong one is a common source of false conclusions.
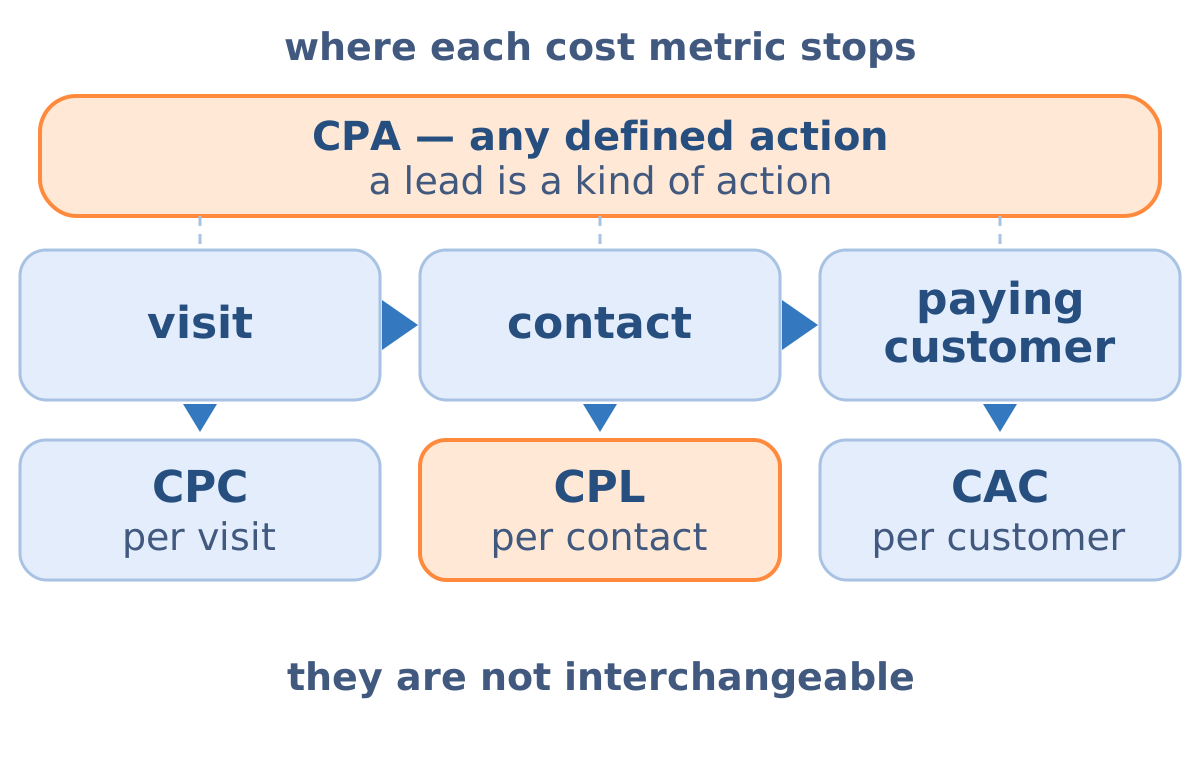
Which of the four a contract, a report or a target refers to has to be settled before the figure in it is agreed to.
CPC (cost per click)
the cost of a visit. It measures the price of attention and says nothing about whether the visit converted.
CPL (cost per lead)
the cost of a contact. It is the first metric tied to an outcome the business can act on.
CPA (cost per action)
the cost of any defined action, of which a lead is one kind. Useful where the action is specified; ambiguous where it is not.
CAC (customer acquisition cost)
the full cost of a paying customer, including sales salaries, commissions and systems. This is the figure that compares with revenue.
The bridge between CPL and CAC is the close rate, and it is the reason a high CPL can be entirely acceptable. On the laboratory's own account 13.6% of commercial enquiries turned into orders — orders divided by commercial enquiries excluding noise, range 11.6–15.0% by denominator, measured from full-year exports (drySEO lab data). Divide a cost per lead by that rate and the cost of a customer appears; compare that against the margin on an order and the campaign is either paying or it is not.
One caveat belongs beside it. Close rate varies by market more than most calculations assume: alongside the measurement stands a directional observation from the laboratory's practice that on markets furthest from a client's core business the same ratio can run at roughly 5–6% (drySEO lab data, directional from practice, not an export — same denominator). At a distance of about 2.5×, the same CPL implies two very different customer costs depending on where the lead came from, which is why the arithmetic is run per market.
The bridge also carries traffic the other way, and that is where a low cost per lead misleads. A cheap contact that never qualifies lowers the cost of a lead and raises the cost of a customer, because the sales time spent filtering it is a real cost that CPL never sees; a dearer, well-profiled contact that qualifies reverses the arithmetic — it costs more per lead, less per customer, and closes sooner. CPL ends at the contact and CAC at the paying customer; the cost of filtering lies between them.
What is a good cost per lead?
A good cost per lead is one that stays well under the profit a lead carries, so that a real part of that profit stays with you — and that figure comes from your own numbers rather than from a table.
The derivation takes two inputs. Multiply your margin on an order by your close rate, and the result is the expected profit a single lead carries before anyone pays for it. A cost per lead below that figure, with room to spare, is good; one approaching it is a campaign working for the media owner.
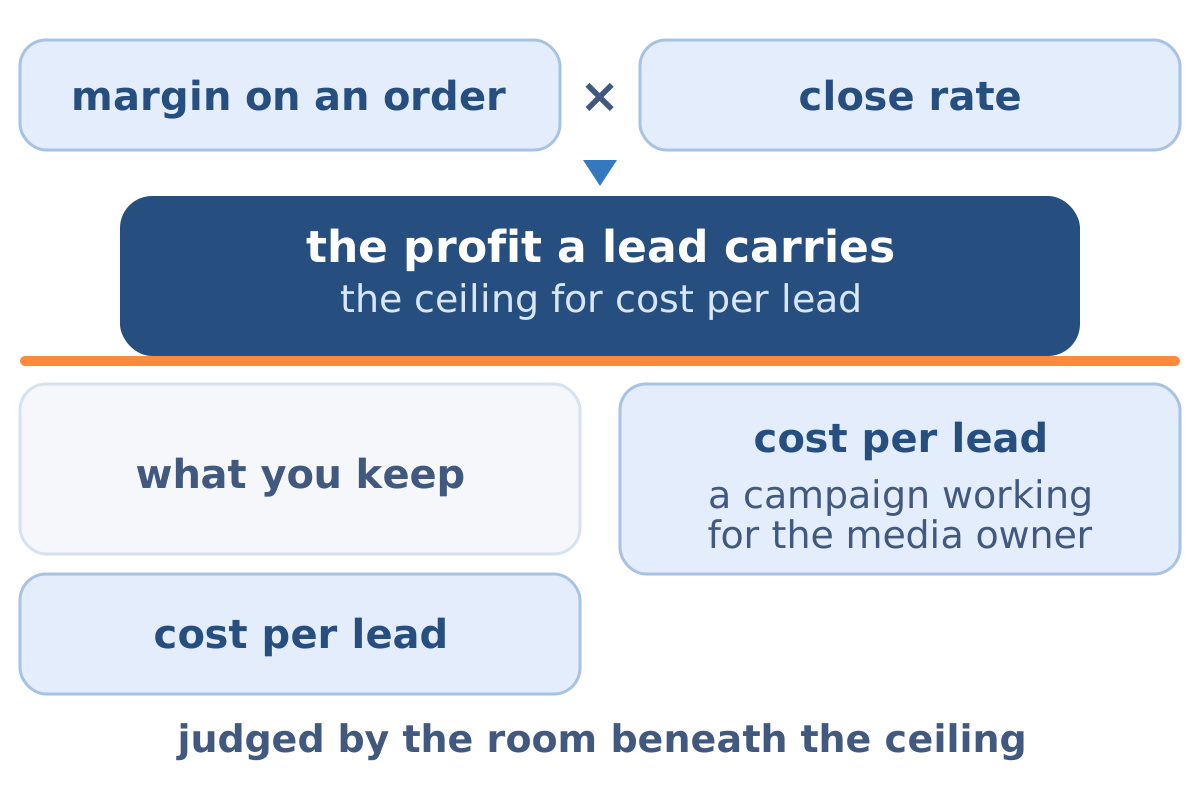
Two properties of that calculation matter. It runs on margin rather than revenue, because margin is what repays the cost of the lead — the same arithmetic on revenue produces a ceiling several times too high and a campaign that looks affordable while losing money. And it is calculated per market and per segment, because both inputs move: the close-rate variation above is larger than most of the differences a channel comparison is trying to detect.
This is also the arithmetic behind how the work here is billed. The product is a lead, so the lead is the unit of settlement, and its price is derived from order margin and close rate, and set low enough to leave part of that profit with the buyer. External costs — advertising budget and developer time — are paid directly to the supplier, which keeps the cost of the medium separate from the cost of the work on the system. The full model is laid out on the page on billing per lead.
How do you lower cost per lead?
Lower cost per lead with three levers, applied in this order because each one makes the next cheaper.
Targeting precision
Excluding companies that cannot buy raises the qualified share of everything that follows, and it acts before any media cost is incurred. The audience definition is on Target Audience.
Conversion on the landing page
The same traffic producing more enquiries lowers CPL without touching the budget, and in most B2B funnels this step sits on the largest base in the whole chain. The mechanics are in the lead conversion guide.
A hybrid of organic and paid
Paid search delivers from the first week and stops with the budget; organic and AI visibility build over months and persist. Running both shortens the feedback loop — paid data reveals which phrasings convert in weeks rather than quarters, and organic coverage reduces what has to be bought on those same phrasings.
A fourth lever is measurement itself, and it is the cheapest of the four. Given the definitional spread above, agreeing denominators frequently reveals that a channel judged expensive was being measured against a stricter denominator than the one it was compared with.
Why do lead generation costs keep rising?
Costs rise because competition for the same attention increases while the supply of high-intent queries stays roughly fixed, so auction prices climb.
Three pressures are visible now. Advertising cost inflation continues as more companies move budget into digital channels competing for the same audiences. Answer engines absorb a growing share of informational queries, which reduces the cheap organic traffic that historically lowered blended cost per lead — while leaving buying-intent queries, where the enquiries actually originate, largely intact. And automation produces more contacts of lower average quality, which raises the value of filtering and makes cost per qualified lead the more honest headline figure.
Frequently asked questions
Should salaries and tools be included in cost per lead?
Yes. CPL calculated from advertising budget alone understates the real cost, and it also distorts channel comparison, since channels differ mainly in how much labour they consume. A full numerator is what makes two channels comparable.
What is the difference between CPL and cost per qualified lead?
CPL counts every acquired contact; cost per qualified lead divides that by the qualification rate and counts only contacts sales will work. The gap between the two is the price of lead quality, and tracking both makes that price visible.
Is a low cost per lead always good?
A low CPL is good when the qualified share holds. Where cheap contacts arrive in volume and fail qualification, CPL falls while customer acquisition cost rises, because the sales time spent filtering them is a real cost that CPL never sees.
Why do marketing and sales report different cost figures?
Usually because they are dividing by different denominators, and often because one is reading an advertising panel while the other reads the CRM — a gap the measurement above puts at 1.4–1.9× in one direction. Reconciling the two systems line by line is what makes a cost report actionable.
How is a campaign's cost judged fairly?
Over four to six weeks at minimum, on a fixed definition, and at the qualified stage. A shorter reading mostly measures noise, and a reading taken at the unqualified stage rewards whichever channel is best at producing contacts that go nowhere. Campaign planning is on Lead Generation Campaign.